When Should You Not Use the f2 Similarity Factor?
Why This Matters
The f2 similarity factor is the default tool for comparing dissolution profiles, and for good reason — it is simple to calculate, well-precedented, and accepted by both FDA and EMA. But f2 is only valid within a specific set of conditions. Outside those conditions, a passing f2 value doesn't demonstrate similarity, and a failing one doesn't necessarily demonstrate a real difference. Both are regulatory risks: the first invites a deficiency letter after submission, and the second sends a formulation team chasing a problem that isn't there.
This article walks through the situations where f2 should not be the sole basis for a similarity conclusion, and what to use instead.
1. When Dissolution Is Too Variable
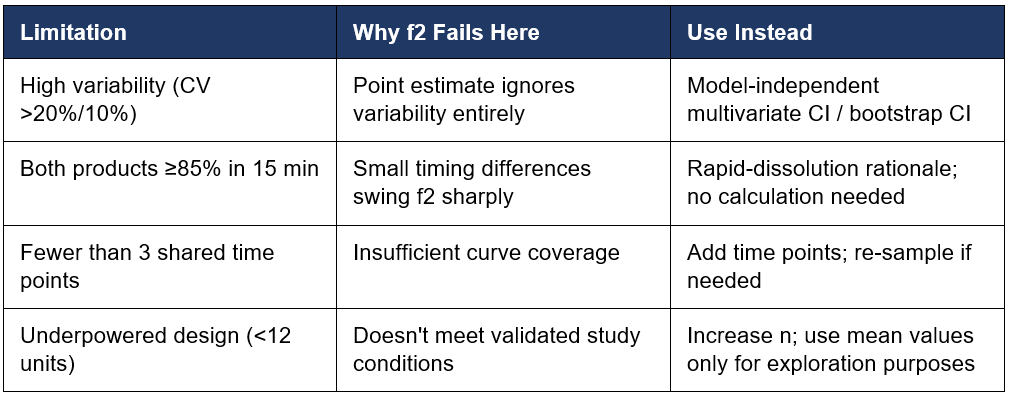
f2 is a model-independent, single-number summary. It has no mechanism for expressing uncertainty, which means it quietly assumes your data are precise enough that the mean curve is a meaningful summary of each formulation. When variability is high, that assumption breaks.
FDA's guidance sets explicit variability ceilings for using f2 at all:
• Coefficient of variation (CV) at the earliest time point (typically the first 10–15 minutes) should not exceed 20%.
• CV at all subsequent time points should not exceed 10%.
If either threshold is exceeded, f2 should not be used as the basis for a similarity conclusion.
In that scenario, both FDA and EMA guidance point to a model-independent multivariate confidence interval approach (comparing the entire dissolution profile using Mahalanobis distance or a bootstrap confidence interval), rather than a single f2 point estimate.
2. When Both Products Dissolve Very Rapidly
If both the test and reference product dissolve 85% or more of the labeled amount within 15 minutes, using a 900 mL medium and standard USP paddle or basket conditions, FDA guidance states that the profiles can be considered similar without further mathematical comparison.
3. When You Have Fewer Than Three Time Points
The f2 equation requires a minimum of three time points (not counting time zero) common to both the test and reference profiles. Below that, there isn't enough of the curve represented to support a similarity claim, no matter how close the calculated value looks.
4. When the Study Design Doesn't Meet Minimum Requirements
f2 also depends on the study being adequately powered. FDA guidance calls for a minimum of 12 dosage units per formulation, with the mean dissolution value used at each time point (not individual unit values). A comparison built on fewer units, or on data that hasn't been properly averaged, doesn't meet the conditions the f2 equation was validated under — even if the arithmetic produces a number.

Summary: f2 Limitation vs. Recommended Alternative
f1 and f2 Calculator Preview
Related Article: How to Use the f1 and f2 Dissolution Calculator.
Do you have any questions or suggestions? Feel free to reach us by clicking here.
Get free pharmaceutical analytical calculation examples, Excel tools, and articles delivered to your inbox.
Frequently Asked Questions
-
f1 (difference factor) and f2 (similarity factor) are model-independent statistical tools used to compare dissolution profiles between a test product and a reference product. They help determine whether two formulations release drug at a similar rate.
-
The f1 factor measures the percentage difference between two dissolution profiles at each time point.
It reflects how much the test product deviates from the reference product.A lower f1 value indicates higher similarity.
-
The f2 factor measures the similarity between two dissolution profiles using a logarithmic transformation of the squared differences between curves.
A higher f2 value indicates greater similarity.
-
0≤f1≤15
50≤f2≤100
If these conditions are met, the dissolution profiles are generally considered similar.
-
Typically:
12 units for the test product
12 units for the reference product
Mean dissolution values are used for comparison.
-
At least:
3 or more dissolution time points (excluding time zero)
Same sampling times must be used for both products
-
No. Only one time point above 85% dissolution should be included for each profile in the f2 calculation.
-
For reliable results:
Early time points: %CV should be ≤ 20%
Later time points: %CV should be ≤ 10%
-
An f2 value of 100 indicates that the two dissolution profiles are identical.
-
An f2 value below 50 indicates that the dissolution profiles are not similar.
-
f2 calculation is generally not required when:
Both products dissolve very rapidly (≥85% within 15 minutes)