Power of Discrimination: Why Your Dissolution Method Must Tell Good Batches From Bad
What "Discriminatory Power" Actually Means
A dissolution method that passes every batch — good or bad — isn't doing its job. Regulators expect a dissolution method to do more than generate a number at a fixed time point: it must be able to tell an acceptable batch from an unacceptable one. This capability is called the method's discriminatory power (or discriminating power), and it is a core expectation woven through USP <1092> and FDA's dissolution guidance.
In practice, this means your method has to be sensitive enough to detect meaningful changes in the drug product's formulation or manufacturing process. If a method returns the same dissolution result regardless of how a critical process parameter or critical material attribute shifts, it isn't discriminating.
The Regulatory Expectation
FDA's guidance on this point is direct:
"Optimum dissolution conditions need to be developed to ensure that the method can discriminate between changes to the drug product formulation and manufacturing process, thereby distinguishing between an acceptable and unacceptable batch."
The guidance then points to USP <1092> for a concrete way to test this. One accepted approach is to intentionally manufacture batches with meaningful variations in the most relevant critical manufacturing variable — typically a ±10%–20% change to the range of that variable — and compare their dissolution profiles against the bio-, pivotal, or clinical batch.
The acceptance threshold is explicit: to demonstrate discriminatory power, the calculated similarity factor (f2) for the altered ("bad") batches should be less than 50 when compared to the reference batch. An f2 below 50 confirms the method detected the intentional change — proof that the method would also catch an unintentional one.
Worked Example
Suppose a method is being challenged for its ability to detect a change in compression force, a critical process parameter for an immediate-release tablet. Three batches are manufactured: the pivotal (reference) batch at target compression force, and two "bad" batches manufactured at +15% and -15% compression force to intentionally stress the variable.
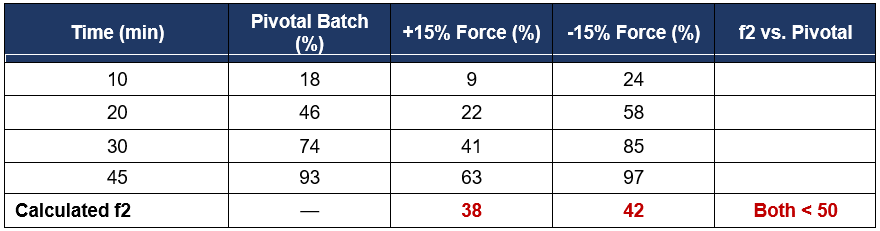
Both altered batches return f2 values below 50 against the pivotal batch — 38 for the +15% compression force batch and 42 for the -15% batch. That result is exactly what you want to see in a discriminatory power study: it confirms the method is sensitive enough to flag a batch manufactured outside the validated process range, rather than passing everything that comes through the door.
Had both f2 values landed at 50 or above, that would signal a problem — not with the batches, but with the method. A method that can't detect a 15% shift in a critical process parameter isn't fit to protect product quality on an ongoing basis, and would need re-optimization of conditions such as agitation speed, medium composition, or apparatus before it could be considered validated.
How to Select the Variable to Challenge
Not every process parameter is worth stressing for a discriminatory power study. USP <1092> points toward the variable most likely to affect in vivo performance — typically one identified during formulation development or risk assessment as a critical material attribute (CMA) or critical process parameter (CPP). Common candidates include:
● Compression force / tablet hardness
● Particle size of the drug substance or a key excipient
● Coating weight gain (for film-coated or modified-release products)
● Blend or granulation time
● Disintegrant or binder level (quantitative changes only)
One important caveat worth flagging for your method development team: outright removal of a functional excipient such as a binder or disintegrant is generally discouraged as a way to demonstrate discriminatory power. The goal is to simulate a realistic manufacturing deviation, not to engineer an extreme formulation that would never occur in production.
Why This Matters Beyond Validation
Discriminatory power isn't a box to check once during method development and forget. A method proven discriminatory at validation is the same method relied on for batch release, stability monitoring, and post-approval change assessment for the life of the product. If the method can't reliably distinguish good batches from bad ones, every one of those downstream decisions inherits that blind spot.
Key Takeaways
● A dissolution method must be shown to distinguish acceptable batches from unacceptable ones — not simply produce a passing number.
● USP <1092> supports demonstrating this via intentionally altered ("bad") batches with a ±10%–20% change to a critical manufacturing variable or to the formulation.
● The acceptance threshold is f2 < 50 when the altered batch is compared to the bio-, pivotal, or clinical batch.
● Avoid demonstrating discriminatory power by removing a functional excipient outright — favor realistic process-range challenges instead.
How Excel in Science Can Help
Running an f2 comparison across multiple challenge batches by hand means recalculating the similarity factor formula for each pairing, tracking which time points qualify for inclusion, and manually checking the %CV thresholds at each stage — all before you can even interpret the result. The f1/f2 Dissolution Calculator automates the full comparison, flags any batch that fails to demonstrate discrimination, and outputs a clean, submission-ready summary table in seconds.
f1 and f2 Calculator Preview
Related Article: How to Use the f1 and f2 Dissolution Calculator.
Do you have any questions or suggestions? Feel free to reach us by clicking here.
Reference
U.S. Food and Drug Administration, Center for Drug Evaluation and Research (CDER) — Dissolution Testing guidance, referencing USP General Chapter <1092>, The Dissolution Procedure: Development and Validation.
Get free pharmaceutical analytical calculation examples, Excel tools, and articles delivered to your inbox.
Frequently Asked Questions
-
f1 (difference factor) and f2 (similarity factor) are model-independent statistical tools used to compare dissolution profiles between a test product and a reference product. They help determine whether two formulations release drug at a similar rate.
-
The f1 factor measures the percentage difference between two dissolution profiles at each time point.
It reflects how much the test product deviates from the reference product.A lower f1 value indicates higher similarity.
-
The f2 factor measures the similarity between two dissolution profiles using a logarithmic transformation of the squared differences between curves.
A higher f2 value indicates greater similarity.
-
0≤f1≤15
50≤f2≤100
If these conditions are met, the dissolution profiles are generally considered similar.
-
Typically:
12 units for the test product
12 units for the reference product
Mean dissolution values are used for comparison.
-
At least:
3 or more dissolution time points (excluding time zero)
Same sampling times must be used for both products
-
No. Only one time point above 85% dissolution should be included for each profile in the f2 calculation.
-
For reliable results:
Early time points: %CV should be ≤ 20%
Later time points: %CV should be ≤ 10%
-
An f2 value of 100 indicates that the two dissolution profiles are identical.
-
An f2 value below 50 indicates that the dissolution profiles are not similar.
-
f2 calculation is generally not required when:
Both products dissolve very rapidly (≥85% within 15 minutes)