Common f2 Calculation Mistakes and How to Avoid Them
The f2 similarity factor is the most widely used tool for comparing dissolution profiles between a test and reference product — but it is also one of the most frequently miscalculated. A single misapplied step can turn a passing comparison into a failing one, or worse, mask a real difference between formulations. Below are the mistakes that show up most often in practice, why they matter, and how to correct them.
1. Ignoring the 85% Dissolution Rule
The f2 equation is only valid up to and including the first time point at which the mean dissolution of either product reaches 85%. Data points collected after that should be excluded from the calculation.
The mistake: Using every time point collected — including 60- and 90-minute pulls — even though the reference product already reached 92% dissolution at 30 minutes.
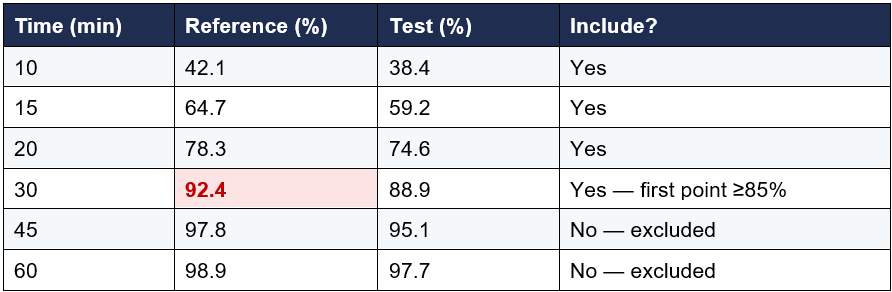
Once one formulation crosses 85%, only that time point is retained; everything after it is dropped from the f2 calculation, even if the other formulation hasn't yet reached 85%.
The scenario that trips people up: the rule triggers on whichever product gets there first — not on both. If the test product reaches 85% at 20 minutes but the reference is still at 74%, the dataset still gets truncated at 20 minutes. The reference's later time points, even the one where it finally crosses 85% itself, are excluded.
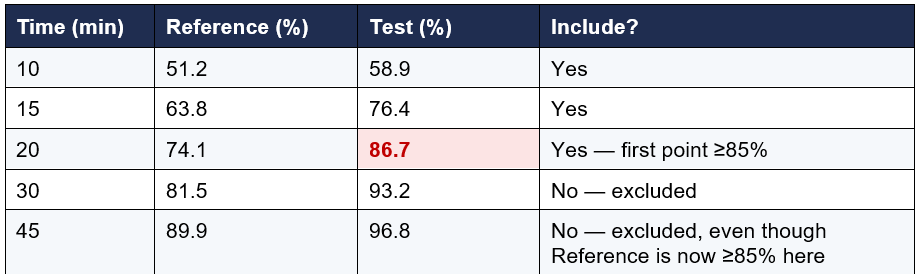
This surprises people because it feels like the comparison is being cut off before the slower formulation has "caught up." But the guidance doesn't require both products to reach 85% — because dissolution data beyond that point adds little discriminating information and tends to inflate similarity artificially (both curves are flattening out near the plateau). Cutting the dataset at 20 minutes here is the correct application of the rule, even though it means the Reference's 89.9% value at 45 minutes never enters the calculation at all.
The practical takeaway: don't wait for both products to individually cross 85% before truncating. Watch each time point as you go, and stop as soon as the first product — whichever one it is — reaches that threshold.
2. Comparing Profiles With Fewer Than 12 Units
Both FDA and EMA specify a minimum of 12 dosage units per formulation for a valid f2 comparison. Using development-scale data (commonly 6 units) produces an f2 value that isn't defensible in a regulatory submission, even if the math is otherwise correct.
• The mistake: running f2 on a 6-unit exploratory batch and reporting it as a formal profile comparison.
• The fix: reserve f2 reporting for datasets with n ≥ 12 per formulation; use smaller datasets only for internal, exploratory screening.
3. Averaging in the Wrong Order
The f2 formula compares the mean percent dissolved at each time point between the two formulations — it does not compare individual unit-to-unit pairs. A common error is pairing units arbitrarily (unit 1 vs. unit 1, unit 2 vs. unit 2) and averaging those differences, rather than first computing the mean dissolution at each time point across all units, then taking the difference of the means.
Correct order of operations:
• Step 1 — average the % dissolved across all units, separately for test and reference, at each time point.
• Step 2 — subtract the reference mean from the test mean at each time point and square the result.
• Step 3 — sum the squared differences across all included time points, divide by the number of time points, add 1, take the square root, then apply the log transformation and multiply by 50.
Reversing steps 1 and 2 — squaring individual unit differences before averaging — inflates the apparent variability between formulations and can produce an artificially low f2 value.
4. Applying f2 Despite High Variability
f2 is only appropriate when variability is controlled. Regulatory guidance sets a %CV (RSD) ceiling of 20% at the first time point and 10% at every time point thereafter, for both formulations.

If any time point after the first exceeds 10% CV (or the first exceeds 20%), f2 should not be used as the sole basis for a similarity conclusion. In that situation, consider a model-independent multivariate confidence interval approach or a model-dependent method instead, and document why f2 alone was insufficient.
5. Rounding Too Early
Rounding percent-dissolved values to whole numbers before squaring the differences can shift a borderline result across the f2 = 50 cutoff.
6. Mixing Up f1 and f2 Acceptance Criteria
f1 (difference factor) and f2 (similarity factor) move in opposite directions, and mixing up their pass/fail thresholds is an easy transcription error to make when summarizing results.

7. Using Different Time Points for Test and Reference
The f2 equation requires that both formulations be sampled at identical time points. Comparing a reference pulled at 10, 20, 30, 45, and 60 minutes against a test product pulled at 15, 30, 45, and 60 minutes produces a meaningless result, since there is no matched Rt/Tt pair for several intervals. Align the sampling schedule for both formulations before testing begins.
8. Running f2 on Very Fast Dissolving Products
When both the test and reference products dissolve more than 85% within 15 minutes, FDA guidance considers the profiles similar without requiring an f2 calculation at all. Running the calculation anyway isn't wrong, but reporting a numeric f2 value in this scenario can invite unnecessary questions about why a formal statistical comparison was performed on products that didn't need one.
How the Excel in Science f2 Calculator Prevents These Mistakes
Every mistake above is a manual step — and one the calculator handles for you automatically. It truncates at the 85% cutoff, flags datasets under 12 units, averages in the correct order, checks %CV against the 20%/10% thresholds, carries full decimal precision, and labels f1/f2 with their correct passing ranges. The result you get is the result a reviewer expects to see.
Download a free trial of the Excel in Science f2 Dissolution Calculator to try it on your own data.
f1 and f2 Calculator Preview
Related Article: How to Use the f1 and f2 Dissolution Calculator.
Do you have any questions or suggestions? Feel free to reach us by clicking here.
Quick Reference Checklist
• Truncate the dataset at the first time point where either product reaches ≥85% dissolution.
• Confirm n ≥ 12 units per formulation before treating the result as reportable.
• Average by time point first, then take the difference — never average pre-squared individual differences.
• Check %CV at each time point (≤20% at the first point, ≤10% thereafter) before relying on f2 alone.
• Carry the decimal places through the calculation; round only the final value.
• Keep f1 (≤15) and f2 (≥50) criteria straight — they move in opposite directions.
• Use identical sampling time points for both formulations.
• Recognize when f2 isn't required at all (both products >85% by 15 minutes).
Get free pharmaceutical analytical calculation examples, Excel tools, and articles delivered to your inbox.
Frequently Asked Questions
-
f1 (difference factor) and f2 (similarity factor) are model-independent statistical tools used to compare dissolution profiles between a test product and a reference product. They help determine whether two formulations release drug at a similar rate.
-
The f1 factor measures the percentage difference between two dissolution profiles at each time point.
It reflects how much the test product deviates from the reference product.A lower f1 value indicates higher similarity.
-
The f2 factor measures the similarity between two dissolution profiles using a logarithmic transformation of the squared differences between curves.
A higher f2 value indicates greater similarity.
-
0≤f1≤15
50≤f2≤100
If these conditions are met, the dissolution profiles are generally considered similar.
-
Typically:
12 units for the test product
12 units for the reference product
Mean dissolution values are used for comparison.
-
At least:
3 or more dissolution time points (excluding time zero)
Same sampling times must be used for both products
-
No. Only one time point above 85% dissolution should be included for each profile in the f2 calculation.
-
For reliable results:
Early time points: %CV should be ≤ 20%
Later time points: %CV should be ≤ 10%
-
An f2 value of 100 indicates that the two dissolution profiles are identical.
-
An f2 value below 50 indicates that the dissolution profiles are not similar.
-
f2 calculation is generally not required when:
Both products dissolve very rapidly (≥85% within 15 minutes)