
How to Choose the Right Time Points for Your f2 Dissolution Calculation
Time point selection is one of the most consequential decisions in an f2 dissolution comparison — and one of the least discussed.
This article walks through every rule that governs time point selection, the errors that most commonly occur, and how to make defensible decisions before you calculate.
Why Time Points Matter So Much
The f2 is sensitive to the number of time points included in the calculation. Add more points in the plateau region — where both products are nearly fully dissolved and sitting close together — and the average squared difference shrinks, pushing f2 upward. Regulators are aware of it, which is why guidance documents explicitly limit which time points can be included.
Including unnecessary late-stage time points where both profiles plateau can artificially inflate f2.
The rules below are designed to prevent exactly this.
Rule 1: Minimum of 3 Time Points, Excluding Time Zero
Both FDA and EMA require a minimum of 3 time points for the f2 calculation, with time zero excluded. But EMA goes further — and this is the detail most scientists miss.
FDA: Minimum of 3 Time Points
FDA guidance requires at least 3 time points (excluding zero) with no specific prescription on where within the profile those points must fall, beyond the general requirement to characterize the ascending and plateau phases. Time zero is excluded and should never be included in the calculation.
Three time points is the minimum, not the target. For most products, you will need more to adequately characterize the shape of the curve.
EMA: Minimum of 3 Time Points — With a Specific Structure
The EMA guideline on bioequivalence specifies not just the number of time points but where they must fall within the profile. If more than 85% of the drug is dissolved within 30 minutes, at least three timepoints are required.
• The first time point must be before 15 minutes
• The second time point must be at 15 minutes
• The third time point must be when dissolution is close to 85%
Rule 2: The Same Time Points Must Be Used for Both Products
The dissolution time points for both profiles should be the same.
You cannot use 15, 30, 45, 60 for one batch and 10, 30, 45, 60 for the other. The time points must be identical across both profiles. This seems obvious, but it is a common source of error when datasets come from different studies or different analysts.
Rule 3: Only One Time Point After 85% Dissolution
This is the rule most frequently misapplied — and also the one where you need to read the actual guidance text carefully.
FDA wording: “Only one measurement should be considered after 85% dissolution of both the products.”
EMA wording: “Not more than one mean value of > 85% dissolved for any of the formulations.”
The cutoff is triggered by whichever product reaches 85% first, whether that is the test or the reference batch. Once either product crosses 85%, only one more time point may be included — all subsequent time points are excluded from the f2 calculation.
Worked example:
Your time points are 10, 15, 30, 45, 60 minutes.
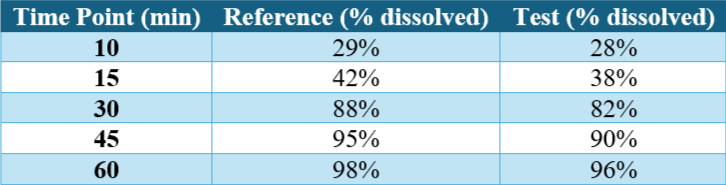
• The reference product crosses 85% first at 30 minutes. The 30-minute point is the first point crossing 85% for either product.
Time points to include in f2: 10, 15, and 30 minutes only. The 45 and 60-minute points are excluded, even though they were measured.
This decision must be documented in your technical report.
Rule 4: No f2 Required When Both Products Dissolve >85% Within 15 Minutes
It is not necessary to compare the dissolution profiles of very rapidly dissolving dosage forms as long as the test and reference products are more than 85% dissolved within 15 minutes in the specified dissolution media.
When this condition is met, f2 does not need to be calculated at all — the profiles are considered similar by regulatory default. This waiver applies to both FDA and EMA.
Importantly, a 15-minute time point should always be included when testing rapidly dissolving dosage forms so that you can confirm whether this exemption applies.
The CV Check: A Gate Before Time Points Even Matter
Before any time point selection decisions are made, the variability of your data at each time point must be checked.
The % coefficient of variation at the earlier time point should not be more than 20%, and at other time points should not be more than 10%.
If your CV exceeds these limits at any time point you intend to include in the f2 calculation, the f2 point estimate is not valid at that time point.
A Step-by-Step Decision Process for Time Point Selection
Use this sequence every time you prepare an f2 calculation:
1. Confirm the same time points appear in both the test and reference datasets.
2. Calculate the mean % dissolved at each time point for both products.
3. Calculate %CV at each time point for both products. Flag any point where CV >20% (early) or >10% (later). If flagged, do not proceed with standard f2 — consider other statistical methods.
4. Identify the first time point where mean dissolution of either product exceeds 85%. Include this point. Exclude all subsequent time points.
5. Confirm you have at least three time points. If you have fewer than three, f2 cannot be validly calculated from this dataset with the current sampling design.
6. Proceed with f2 calculation using the qualifying time points only.
References
U.S. Food and Drug Administration (FDA): Guidance for Industry Dissolution Testing of Immediate Release Solid Oral Dosage Forms
European Medicines Agency (EMA): Guideline on the Investigation of Bioequivalence
Excel in Science builds validated Excel-based calculator tools for pharmaceutical and analytical scientists. Our f2 dissolution profile comparison calculator automates the CV check, applies the 85% rule correctly, and flags ineligible time points before calculating — so the f2 value you report is always built on valid inputs.
f1 and f2 Calculator Preview
Related Article: How to Use the f1 and f2 Dissolution Calculator.
Do you have any questions or suggestions? Feel free to reach us by clicking here.
Frequently Asked Questions
-
f1 (difference factor) and f2 (similarity factor) are model-independent statistical tools used to compare dissolution profiles between a test product and a reference product. They help determine whether two formulations release drug at a similar rate.
-
The f1 factor measures the percentage difference between two dissolution profiles at each time point.
It reflects how much the test product deviates from the reference product.A lower f1 value indicates higher similarity.
-
The f2 factor measures the similarity between two dissolution profiles using a logarithmic transformation of the squared differences between curves.
A higher f2 value indicates greater similarity.
-
0≤f1≤15
50≤f2≤100
If these conditions are met, the dissolution profiles are generally considered similar.
-
Typically:
12 units for the test product
12 units for the reference product
Mean dissolution values are used for comparison.
-
At least:
3 or more dissolution time points (excluding time zero)
Same sampling times must be used for both products
-
No. Only one time point above 85% dissolution should be included for each profile in the f2 calculation.
-
For reliable results:
Early time points: %CV should be ≤ 20%
Later time points: %CV should be ≤ 10%
-
An f2 value of 100 indicates that the two dissolution profiles are identical.
-
An f2 value below 50 indicates that the dissolution profiles are not similar.
-
f2 calculation is generally not required when:
Both products dissolve very rapidly (≥85% within 15 minutes)
Get free pharmaceutical analytical calculation examples, Excel tools, and articles delivered to your inbox.