
Content Uniformity Test for Capsules: Step-by-Step Calculation Using USP <905>
Content uniformity testing is a routine but critical quality control procedure in pharmaceutical manufacturing. For capsules, it confirms that each unit contains the right amount of drug — not just on average, but individually.
In this article, we walk through a complete content uniformity calculation for capsules using USP <905>, with real data from 30 units. The example includes both the L1 and L2 stages — because the L1 result in this dataset fails, making it a realistic and instructive case study for understanding the full two-stage testing process.
All intermediate calculations are carried at full precision throughout. No rounding occurs until the final reported values.
1. What Is Content Uniformity Testing?
Content uniformity testing verifies that the amount of active ingredient in individual dosage units falls within acceptable limits. It is required by USP <905> (Uniformity of Dosage Units) for most solid oral dosage forms, including capsules.
For capsules, each unit is individually assayed and the result is expressed as a percentage of the label claim. These values are used to calculate the Acceptance Value (AV) — which determines whether the batch passes or fails.
Note: The AV calculation is identical for tablets and capsules. The difference lies in sample preparation — capsule shells must be separated and the fill contents assayed individually.
2. The Acceptance Value Formula
AV = |mean − M| + k × SD
Where:
mean = arithmetic mean of individual % label claim values
M = reference value (determined from the mean)
k = acceptability constant (2.4 for n=10; 2.0 for n=30)
SD = sample standard deviation
How M is Determined
• If 98.5% ≤ mean ≤ 101.5% → M = mean
• If mean < 98.5% → M = 98.5%
• If mean > 101.5% → M = 101.5%
When M = mean, the term |mean − M| = 0, and AV is driven entirely by k × SD. This is the most common scenario and means variability alone determines whether the batch passes.
3. Acceptance Criteria: L1 and L2
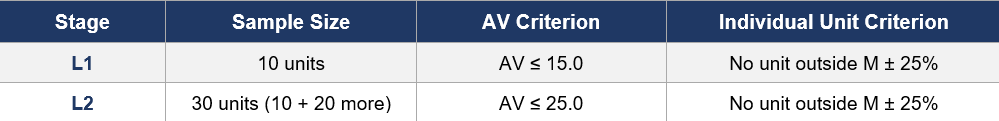
Testing begins at L1 with 10 units. If L1 passes, the batch passes. If L1 fails but all individual units are within M ± 25%, you may proceed to L2 by testing 20 additional units and recalculating AV on all 30.
If any individual unit falls outside M ± 25% at any stage, the batch fails immediately — regardless of the AV.
4. Stage 1 (L1): First 10 Units
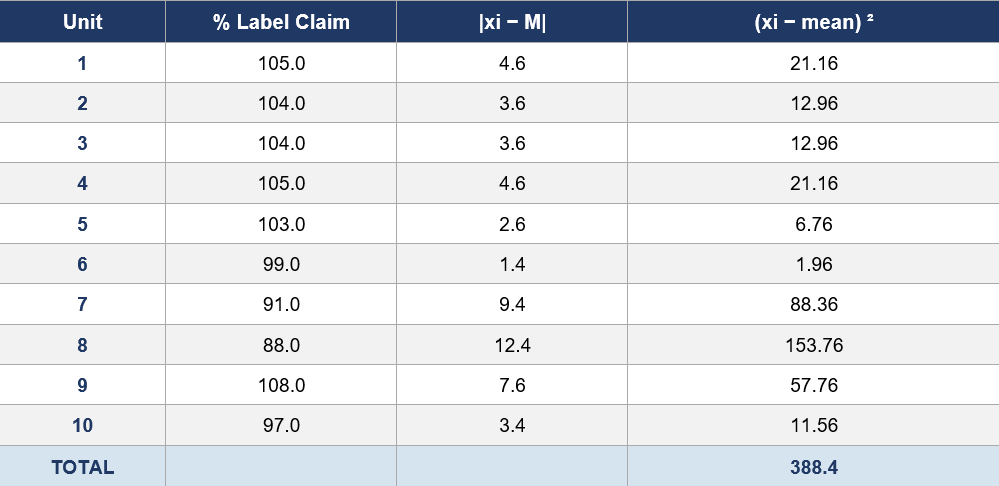
4.1 The L1 Dataset
4.2 L1 Calculation
1. n = 10
2. Mean = (105 + 104 + 104 + 105 + 103 + 99 + 91 + 88 + 108 + 97) / 10 = 1004 / 10 = 100.4
3. Σ(xi − mean)² = 388.4
4. SD = √[Σ(xi − mean)² / (n−1)] = √[388.40 / 9] = 6.5692888166
5. M = 100.4000000000 (mean is within 98.5–101.5%, so M = mean)
6. |mean − M| = 0.0000000000
7. k = 2.4 (for n = 10)
8. k × SD = 2.4 × 6.5692888166 = 15.7662931598
9. AV = 0.0000000000 + 15.7662931598 = 15.7662931598
AV (L1) = 15.7662931598
Rounded: AV = 15.8
4.3 L1 Individual Unit Check
Each unit must fall within M ± 25%: 75.4000000000% to 125.4000000000%.Unit 1: 105.0% → Within limits ✓
Unit 2: 104.0% → Within limits ✓
Unit 3: 104.0% → Within limits ✓
Unit 4: 105.0% → Within limits ✓
Unit 5: 103.0% → Within limits ✓
Unit 6: 99.0% → Within limits ✓
Unit 7: 91.0% → Within limits ✓
Unit 8: 88.0% → Within limits ✓
Unit 9: 108.0% → Within limits ✓
Unit 10: 97.0% → Within limits ✓
4.4 L1 Result

AV = 15.77 exceeds the L1 criterion of 15.0 — L1 FAIL.
All individual units are within M ± 25% — eligible to proceed to L2.
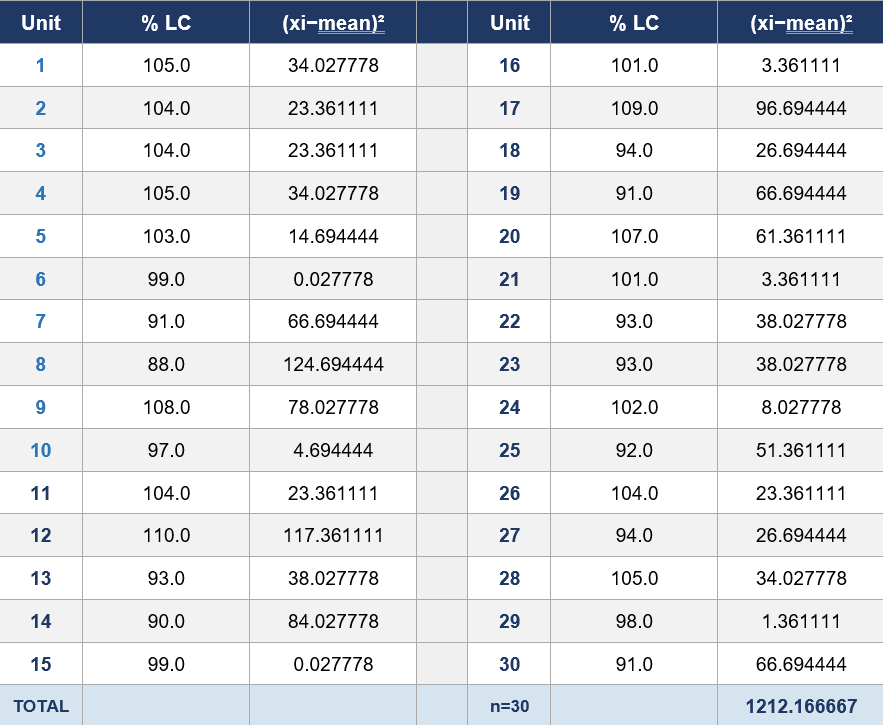
5. Stage 2 (L2): All 30 Units
5.2 L2 Calculation
1. n = 302. Mean = 2975 / 30 = 99.16666666673. Σ(xi − mean)² = 1212.16666666674. SD = √[1212.1666666667 / 29] = 6.46520305755. M = 99.1666666667 (mean is within 98.5–101.5%, so M = mean)6. |mean − M| = 0.00000000007. k = 2 (for n = 30)8. k × SD = 2 × 6.4652030575 = 12.93040611509. AV = 0.0000000000 + 12.9304061150 = 12.9304061150AV (L2) = 12.9304061150Rounded: AV = 12.9
5.3 L2 Individual Unit Check
Each unit must fall within M ± 25%: 74.1666666667% to 124.1666666667%.All 30 units were checked against these limits. All units are within range.5.4 L2 Result

AV = 12.93 ≤ 25.0 — L2 PASS.
All 30 individual units are within M ± 25% — PASS.
The batch passes the content uniformity test at L2.
6. What This Example Teaches Us
This dataset is a good illustration of how the two-stage testing process works in practice:• The mean at L1 (100.4%) and L2 (99.2%) are both well within the label claim range — the product is on target on average.• The L1 failure was driven entirely by high unit-to-unit variability (SD = 6.57%), pushing AV above 15.• At L2, the additional 20 units brought the SD down slightly (6.4652%) and — combined with the more lenient L2 criterion of ≤ 25 — the batch passed.• No individual unit was ever outside M ± 25%, which is what kept the batch eligible for L2 testing throughout.7. Where Manual Calculations Go Wrong
• Using population SD (dividing by n) instead of sample SD (dividing by n−1) — underestimates variability and gives a lower AV than correct• Wrong k value — k = 2.4 for n=10, k = 2.0 for n=30. Using 2.0 at L1 gives a more favorable AV than the standard allows• Incorrectly determining M — using 100 instead of the actual mean when the mean is within 98.5–101.5%• Forgetting the individual unit check — a batch can fail on individual units even when AV passes• Mixing up L1 and L2 criteria — applying AV ≤ 25 at L1 or AV ≤ 15 at L2• Not recalculating mean and M at L2 — using L1 values instead of the full 30-unit dataset8. A Faster, More Reliable Approach
Our Content Uniformity Calculator for USP <905> handles all of this automatically. Enter your individual % label claim values and the tool:• Calculates mean, SD, and RSD at full precision from your raw data• Determines M correctly based on where the mean falls• Automatically applies the correct k value automatically for n=10 and n=30• Calculates AV and checks each unit against M ± 25%• Displays L1 and L2 pass/fail results with clear formatting• Includes a validation package for the tool
Built in Excel — nothing to install, nothing to learn.Your data never leaves your environment.Visit Excel in Science to learn more or request the calculator.
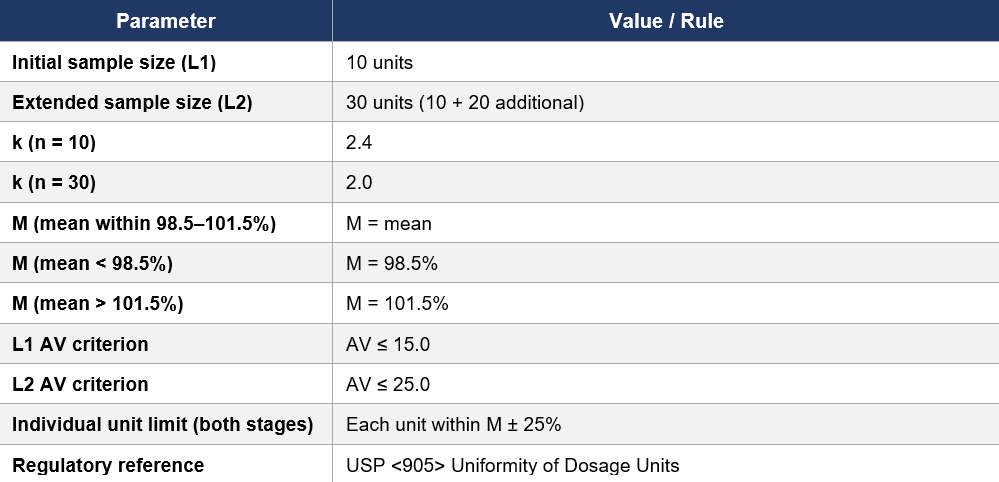
9. Quick Reference: USP <905> Content Uniformity
Final Thoughts
This example covers the full two-stage content uniformity test — from L1 calculation and failure, through the decision to proceed to L2, to the final passing result. Both stages are part of the same USP <905> procedure, and understanding when and how to move between them is essential for anyone working in pharmaceutical analytical workflows.Questions about the method or the calculator? Reach out — we’re happy to help.
— Excel in Science
References
USP General Chapter <905> Uniformity of Dosage Units. United States Pharmacopeia.