f1 vs. f2: Understanding Dissolution Similarity Factors
And Why f2 Is the Preferred Regulatory Metric
Introduction
When comparing a test dissolution profile to a reference profile — for a formulation change, a scale-up batch, or a generic submission — regulatory guidance points to two model-independent statistics: the difference factor (f1) and the similarity factor (f2). Both are calculated from the same paired dissolution data, but they behave very differently, and only one of them (f2) carries a globally harmonized acceptance criterion. This article walks through how each is calculated, where they diverge numerically, and why f2 has become the default metric QC and regulatory affairs teams rely on.
What Is f1 (Difference Factor)?
f1 measures the percent difference between the test and reference curves at each time point, summed and normalized against the total reference dissolution.
f1 = { [Σ|Rt − Tt|] / [ΣRt] } × 100
Where Rt is the mean percent dissolved of the reference product at time t, and Tt is the mean percent dissolved of the test product at the same time point. An f1 value of 0 indicates identical profiles; values increase as the profiles diverge. FDA's 1997 Guidance for Industry on dissolution testing of immediate-release solid oral dosage forms identifies f1 ≤ 15 as consistent with similarity.
What Is f2 (Similarity Factor)?
f2 is a logarithmic transformation of the sum of squared differences between the two curves, scaled to fall between 0 and 100.
f2 = 50 × log10{ [1 + (1/n)Σ(Rt − Tt)²]^−0.5 × 100 }
Here n is the number of time points, and the squared-difference term means larger point-to-point gaps are penalized more heavily than smaller ones. An f2 of 100 indicates identical profiles; f2 ≥ 50 is the acceptance threshold referenced by FDA and by EMA's Guideline on the Investigation of Bioequivalence (CPMP/EWP/QWP/1401/98 Rev. 1).
Key Differences at a Glance
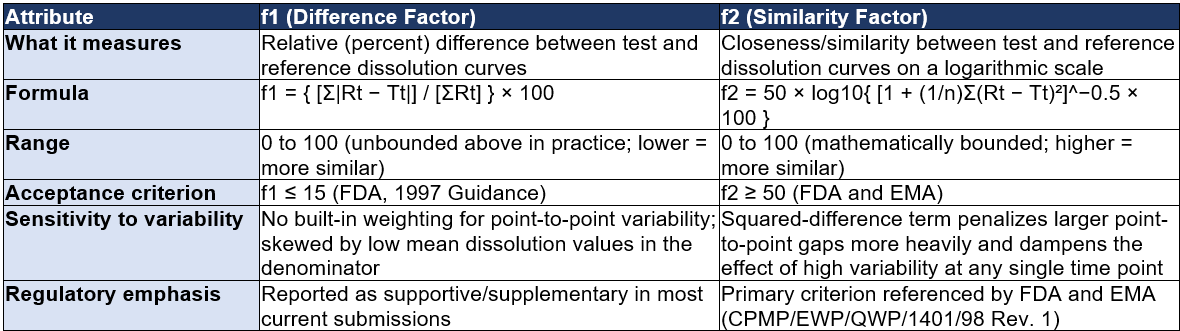
Table 1. Structural and regulatory differences between f1 and f2.
Worked Example
Consider a reference and test product sampled at five time points, with only one point sampled after 85% dissolution of the reference product — consistent with FDA/EMA recommendations for calculating similarity factors.
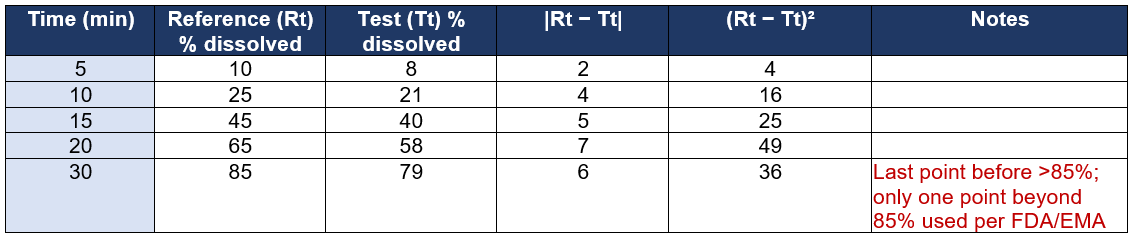
Table 2. Paired dissolution data used for the f1 and f2 calculations below.
f1 Calculation
Σ|Rt − Tt| = 2 + 4 + 5 + 7 + 6 = 24
ΣRt = 10 + 25 + 45 + 65 + 85 = 230
f1 = (24 / 230) × 100 = 10.43
f2 Calculation
Σ(Rt − Tt)² = 4 + 16 + 25 + 49 + 36 = 130
(1/n)Σ(Rt − Tt)² = 130 / 5 = 26
f2 = 50 × log10{ [1 + 26]^−0.5 × 100 } = 50 × log10(19.62) = 50 × 1.293 = 64.6
Both statistics pass their respective thresholds in this example (f1 = 10.4 ≤ 15; f2 = 64.6 ≥ 50), so the two curves would be considered similar by either method. The gap between them widens, however, as variability increases at individual time points — which is where f2's squared-difference term and f1's simple percent-difference term start to disagree.
Why f2 Is Preferred Over f1
• Bounded, single-number scale: f2 is mathematically constrained to 0–100, making cross-study and cross-product comparisons more consistent. f1 has no natural upper bound and is more easily distorted by a low reference denominator (ΣRt) when early time points have small dissolution values.
• Better handling of variability: because f2 squares each point-to-point difference before averaging, it penalizes profiles with a few large deviations more appropriately than f1's straight absolute-difference sum, which treats every point equally regardless of scatter.
• Harmonized global acceptance criterion: f2 ≥ 50 is referenced by FDA and by EMA's Bioequivalence Guideline, giving sponsors one criterion that satisfies multiple jurisdictions. f1 is typically reported as supportive context rather than a stand-alone pass/fail criterion in current submissions.
• Statistical grounding: f2 was derived by Moore and Flanner (1996) specifically to model the similarity of dissolution profiles as a function of the mean squared difference, giving it a clearer statistical rationale than the more ad hoc percent-difference approach of f1.
• Industry and reviewer familiarity: because f2 is the metric agencies scrutinize most closely, review teams and QC scientists are more calibrated to interpreting borderline f2 values (45–55) than borderline f1 values.
Practical Requirements for a Valid f2 Calculation
• A minimum of three time points (excluding time zero) is required.
• Only one time point after 85% dissolution of the reference product should be included in the calculation.
• The percent coefficient of variation (%CV) at the first time point should not exceed 20%, and at subsequent time points should not exceed 10%.
• Mean dissolution values are typically calculated from 12 dosage units per product.
• The same time points must be used for both the reference and test products.
Conclusion
f1 and f2 are calculated from the same underlying dissolution data but answer slightly different questions: f1 quantifies relative percent difference, while f2 quantifies overall curve similarity on a scale that is easier to interpret and more resistant to distortion from variability. Because f2 carries a harmonized global acceptance criterion and a stronger statistical foundation, it remains the metric regulatory reviewers weight most heavily — with f1 reported alongside it as supporting evidence rather than a primary decision point.
f1 and f2 Calculator Preview
Related Article: How to Use the f1 and f2 Dissolution Calculator.
Do you have any questions or suggestions? Feel free to reach us by clicking here.
References:
FDA Guidance for Industry, Dissolution Testing of Immediate Release Solid Oral Dosage Forms (1997); EMA Guideline on the Investigation of Bioequivalence, CPMP/EWP/QWP/1401/98 Rev. 1; Moore, J.W. and Flanner, H.H., "Mathematical Comparison of Dissolution Profiles," Pharmaceutical Technology, 1996.
Get free pharmaceutical analytical calculation examples, Excel tools, and articles delivered to your inbox.
Frequently Asked Questions
-
f1 (difference factor) and f2 (similarity factor) are model-independent statistical tools used to compare dissolution profiles between a test product and a reference product. They help determine whether two formulations release drug at a similar rate.
-
The f1 factor measures the percentage difference between two dissolution profiles at each time point.
It reflects how much the test product deviates from the reference product.A lower f1 value indicates higher similarity.
-
The f2 factor measures the similarity between two dissolution profiles using a logarithmic transformation of the squared differences between curves.
A higher f2 value indicates greater similarity.
-
0≤f1≤15
50≤f2≤100
If these conditions are met, the dissolution profiles are generally considered similar.
-
Typically:
12 units for the test product
12 units for the reference product
Mean dissolution values are used for comparison.
-
At least:
3 or more dissolution time points (excluding time zero)
Same sampling times must be used for both products
-
No. Only one time point above 85% dissolution should be included for each profile in the f2 calculation.
-
For reliable results:
Early time points: %CV should be ≤ 20%
Later time points: %CV should be ≤ 10%
-
An f2 value of 100 indicates that the two dissolution profiles are identical.
-
An f2 value below 50 indicates that the dissolution profiles are not similar.
-
f2 calculation is generally not required when:
Both products dissolve very rapidly (≥85% within 15 minutes)