
Enroll in our Data Processing in Excel course for Scientists for only $99!
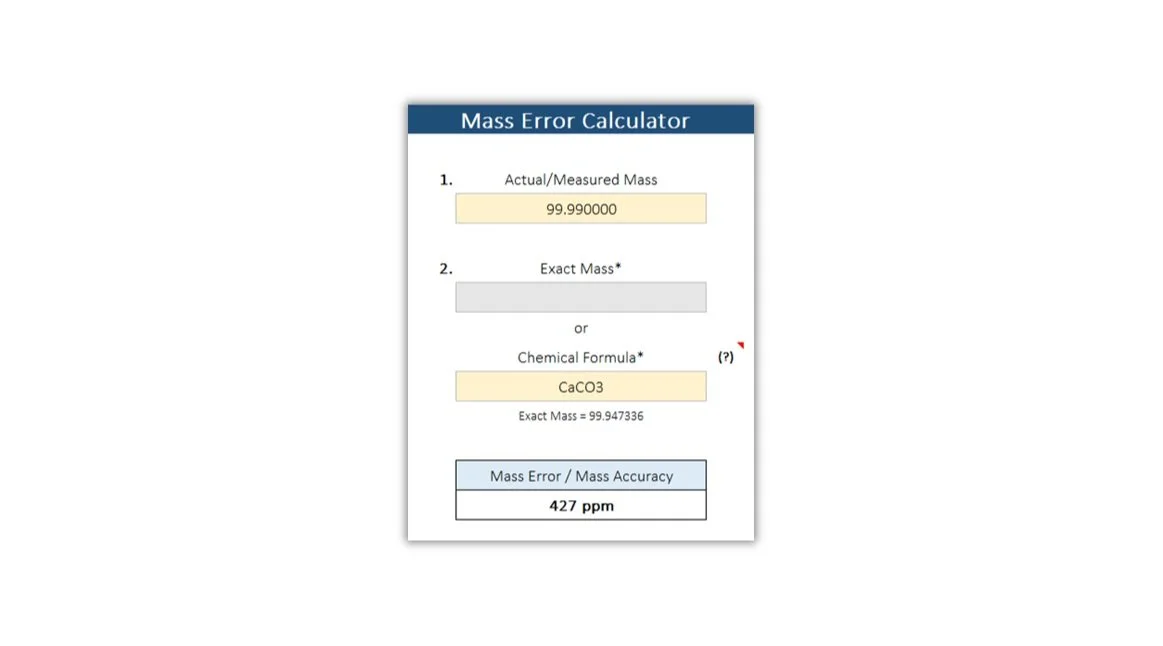
Understanding Mass Accuracy in High Resolution Mass Spectrometry
Mass accuracy in HRMS refers to the precision and correctness with which the mass spectrometer measures the m/z of ions. It quantifies the degree to which the measured m/z values of ions correspond to their true or expected values.

Streamlining Data Analysis with an Automated Dissolution Graph Builder
Scientists often spend countless hours manually creating graphs to visualize and interpret their data. An automated dissolution graph builder in Excel simplifies the process of creating dissolution graphs.

Understanding Significant Figures
In science, engineering, and everyday calculations, precision matters. Understanding significant figures is essential because these figures not only convey the accuracy of a measurement but also reflect the level of confidence one can have in the result.

Creating a Dissolution Graph in GraphPad Prism
GraphPad Prism is a powerful software tool widely used for scientific and statistical analysis. It offers a range of features for creating different types of graphs, including dissolution graphs.

The Magic Wand in GraphPad Prism: A User's Guide
The Magic Wand tool in GraphPad Prism allows you to apply a specific analysis or format from one data table or graph to another without having to manually repeat the process.

Making Graphs Look Nice in GraphPad Prism
Here are some tips to achieve visually appealing and informative graphs using GraphPad Prism.

Utilizing the Ion Ratio as a Criterion for the Identification of Analytes in Mass Spectrometry
While a triple quadrupole mass spectrometer offers excellent selectivity, there remains a possibility of a compound other than the target analyte to produce a signal with a similar m/z value to the qualifying or quantifying ion at the same retention time.

How to Set Dissolution Specifications
Setting reliable and appropriate specifications for dissolution testing is essential for ensuring that the drug product is consistent in quality and performance.

USP <711> Dissolution Stage Testing Explained (+ Excel Calculator for Stage 1, 2, and 3 Testing)
Learn how USP <711> dissolution stage testing works, including Stage 1, Stage 2, and Stage 3 acceptance criteria. Includes Excel calculator template for automatic pass/fail evaluation

Exact Mass Calculator in Excel
The monoisotopic mass, also known as the exact mass of a molecule, is determined by adding the exact masses of the most abundant isotopes of its component elements.

USP <905> Uniformity of Dosage Units Explained (+ Excel Calculator Templates)
Learn how USP <905> uniformity of dosage testing works, including content uniformity and weight caration methods, acceptance value calculations, and Excel templates for pharmaceutical analysis

How to Calculate USP <905> Content Uniformity in Excel
Step-by-step guide for calculating USP <905> content uniformity and acceptance value (AV) in Excel with downloadable spreadsheet template

USP <905> Weight Variation Testing Explained (+ Excel Calculator Template)
Learn how USP <905> weight variation testing is performed in pharmaceutical analysis, including acceptance criteria, calculations, and downloadable calculator template.

Tablet Scoring Guidance in Pharmaceuticals: FDA and USP Considerations
Understand tablet scoring requirements for pharmaceutical products, including regulatory guidance, dissolution considerations, content uniformity, and functional score evaluation.
Evaluating Tablet Splitability by Calculating Loss of Mass (+ Excel calculator)
Learn how to evaluate tablet splitability by calculating loss of mass. Includes Excel calculator.

USP <1216> Tablet Friability Testing Explained (+ Excel Calculator Template)
Understand USP <1216> tablet friability testing including loss of mass calculations, aceptance criteria. Includes automated loss of mass calculator.

Leveraging Ion Ratio for Analyte Confirmation in Mass Spectrometry
Analysis of chemical compounds by liquid chromatography-tandem mass spectrometry (LC-MS/MS) in complex samples presents unique challenges that should be considered.

How to transform Empower raw data into an organized Excel table in 2 minutes
Raw data from Empower typically contains a ton of information that we do not need and extracting the important data can be a time-consuming task.

How to use the F1 and F2 Dissolution Calculator Excel Tool
Learn how to use the F1 & F2 dissolution calculator to compare similarity factors in drug release profiles. Simple guide on how to use the Excel tool.

Exploring the Power of Pivot Tables: Three Essential Features for Enhancing Data Analysis
In this article, we'll explore three powerful features within pivot tables that can help enhance your data analysis process.