
How to Compare Dissolution Profiles Using f1 and f2: Step-by-Step Example
If you work in pharmaceutical development or quality control, comparing dissolution profiles is a routine task — but one that deserves careful attention. Whether you're evaluating a manufacturing change, a scale-up, or a site transfer, the f1 and f2 similarity factors are the standard regulatory tools you’ll reach for.

In this article, we walk through a complete f1/f2 calculation using a real dataset: a pre-change (Reference) vs. post-change (Test) dissolution comparison with 12 replicates per time point. We’ll show you every step — the raw data, the exact means, the calculation, and the interpretation — and then show where manual calculations tend to go wrong.
1. What Are f1 and f2?
The f1 and f2 similarity factors are the standard regulatory approach for comparing dissolution profiles (FDA 1997 Guidance).
• f1 (Difference Factor) measures the percent difference between two profiles. Lower is better.
• f2 (Similarity Factor) measures similarity on a logarithmic scale. Higher is better.
Acceptance criteria:
• f1 ≤ 15
• f2 ≥ 50
2. The Formulas
f1 = { [Σ|Rt − Tt|] / [Σ Rt] } × 100
f2 = 50 × log₁₀ { [1 + (1/n) Σ(Rt − Tt)²]⁻°·⁵ × 100 }
Where Rt = mean % dissolved of the Reference at time t, Tt = mean % dissolved of the Test at time t, and n = number of time points included.
Important: all intermediate values — means, differences, squared differences, and sums — are carried at full precision. No rounding occurs until the final reported f1 and f2 values.
3. The Dataset
This example compares a Reference (Prechange) and Test (Postchange) immediate-release product across 6 nominal time points (5, 10, 15, 30, 45, and 60 min), with n = 12 replicates each. Means are calculated directly from the 12 individual values at full precision.
3.1 Reference (Prechange) — Raw Data
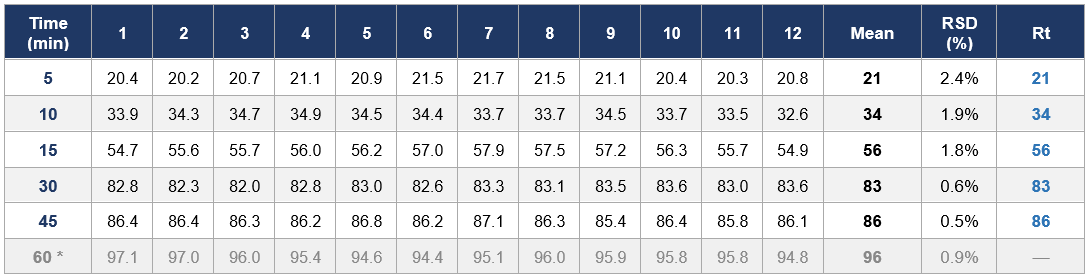
* 60 min excluded from f1/f2 calculation (see Section 4).
3.2 Test (Postchange) — Raw Data
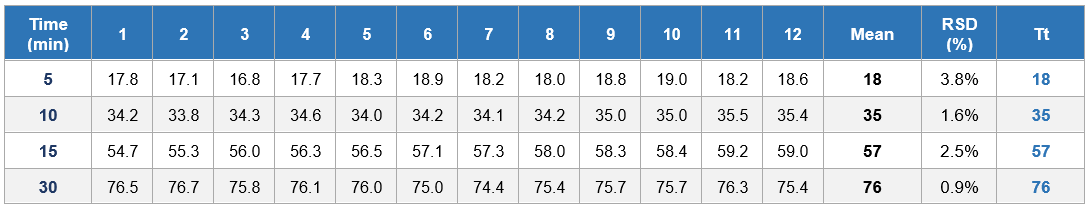
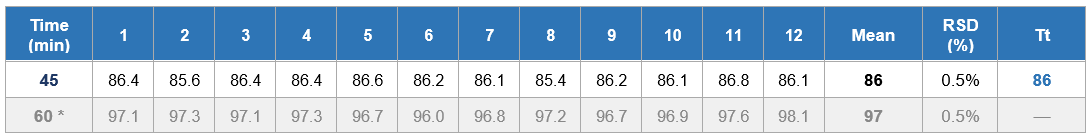
* 60 min excluded from f1/f2 calculation (see Section 4).
4. Applying the 85% Rule
Before calculating f1 and f2, you need to check how many time points have a Reference mean above 85%.
• At 30 min: Rt = 83% — below 85%, included.
• At 45 min: Rt = 86% — above 85%. This is the FIRST time point exceeding 85%. Included.
• At 60 min: Rt = 96% — above 85%, but this would be a SECOND point above 85%. Excluded.
Only ONE time point where Rt > 85% may be included.60 min is excluded. The calculation uses 5 time points: 5, 10, 15, 30, and 45 min.
5. Step-by-Step Calculation
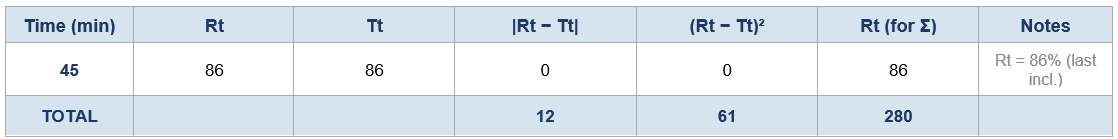
Step 1 — Exact Means and Calculation Table
The means used below are computed directly from the 12 replicates at full precision — no rounding at this stage.

Step 2 — Calculate f1
Σ|Rt − Tt| = 11.516667
Σ Rt = 280.391667
f1 = (11.516667 / 280.391667) × 100
f1 = 0.04107350 × 100
f1 = 4.107350
Rounded result: f1 = 4.11
f1 = 4.11. Acceptance criterion: ≤ 15. This passes.
Step 3 — Calculate f2
1. n = 5 time points
2. Σ(Rt − Tt)² = 60.887361
3. (1/n) × Σ = 60.887361 / 5 = 12.17747222
4. 1 + above = 13.17747222
5. Raise to power of −0.5: 13.17747222⁻°·⁵ = 0.2754761123
6. × 100 = 27.5476112293
7. log₁₀ of above = 1.4400839453
8. × 50 = 72.004197
f2 = 72.004197
Rounded result: f2 = 72.00
f2 = 72.00. Acceptance criterion: ≥ 50. This passes.
Step 4 — Results Summary
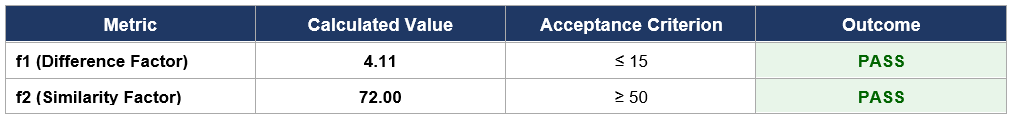
Both criteria are met. The Test (Postchange) profile is considered similar to the Reference (Prechange) profile.
6. Where Manual Calculations Go Wrong
The steps above look manageable — but here’s what happens in practice when scientists try to do this in a plain Excel sheet or by hand:
• Wrong logarithm: Excel’s LN() gives natural log. f2 requires LOG() (base 10). This is one of the most common errors.
• Operator precedence: The −0.5 exponent must be applied to the entire bracketed expression. A misplaced parenthesis silently gives you the wrong answer.
• Rounding intermediate values: Using rounded means (e.g., 21 instead of 20.8833) introduces compounding error through every subsequent step.
• Missing the 85% check: Without an automated flag, it’s easy to forget to exclude time points — or to exclude the wrong one.
• Hardcoded n: If you build a sheet for 6 time points and then exclude one, forgetting to update n throws off your f2.
• No CV check: Without a variability check built in, you might use data that doesn’t qualify for f1/f2 comparison in the first place.
• No audit trail: A plain Excel sheet with unlocked cells gives you no traceability for regulatory review.
Every one of these is a real risk. And the troubling part is that you won’t always know when you’ve made the mistake — the calculation will still produce a number.
7. A Faster and More Reliable Way
This is exactly what our f1/f2 Dissolution Profile Comparison Calculator was built to handle.
You enter your individual replicate values, and the tool:
• Calculates means at full precision directly from your raw replicates — no manual mean entry
• Flags any time point where Rt > 85% and alerts you if more than one would be included
• Applies the correct f1 and f2 formulas with no intermediate rounding
• Checks CV thresholds and flags non-qualifying data
• Displays a clear, formatted results summary with pass/fail status
What you’ve seen laid out across multiple steps in this article — the tool handles in a minute, with validated formulas and a consistent format every time.
Built in Excel — nothing to install, nothing to learn.
Your data never leaves your environment.
Visit Excel in Science to learn more or request the calculator.
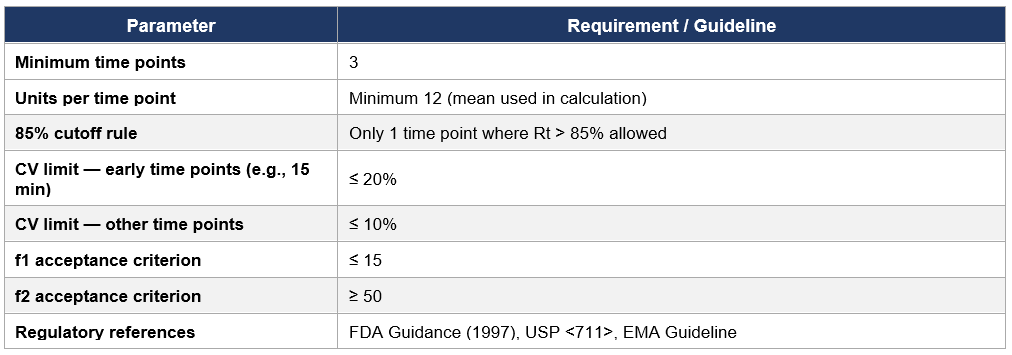
8. Quick Reference: f1/f2 Rules and Criteria
Final Thoughts
The f1/f2 comparison is one of those calculations that looks simple on paper but hides a surprising number of ways to go wrong. Understanding each step — the 85% rule, the formula structure, the importance of carrying full precision through intermediate steps — is essential for producing results you can trust and defend.
Once you understand it, though, there’s no reason to rebuild it from scratch every time. A validated, purpose-built tool is what this calculation needs.
Questions about the method or the tool? Reach out — we’re always happy to talk dissolution.
— Excel in Science
References
FDA Guidance for Industry. Dissolution Testing of Immediate Release Solid Oral Dosage Forms. August 1997.
EMA Guideline on the Investigation of Bioequivalence. CPMP/EWP/QWP/1401/98 Rev. 1.